Build a controlled evaluation sample
I reduced 28,587 source tickets to 16,338 English records and evaluated 300 successful classifications.
AI Validation · Operations Analytics
Measured performance defines where AI can assist and where human review must remain.
My approach
I reduced 28,587 source tickets to 16,338 English records and evaluated 300 successful classifications.
I measured accuracy, precision, recall, F1, and confusion matrices instead of trusting model confidence.
I retained human review for priority and department routing and qualified only a limited category case.
Governance decision
Model confidence does not replace measured accuracy.
Validation results
The weakest outputs remain under human control.
Category accuracy.
Priority accuracy.
Department accuracy.
Decision evidence
The dashboard separates observed operations, measured model performance, and recommendation evidence.
Why this visual exists. Ticket volume is kept separate from a scenario model for possible time and cost savings.
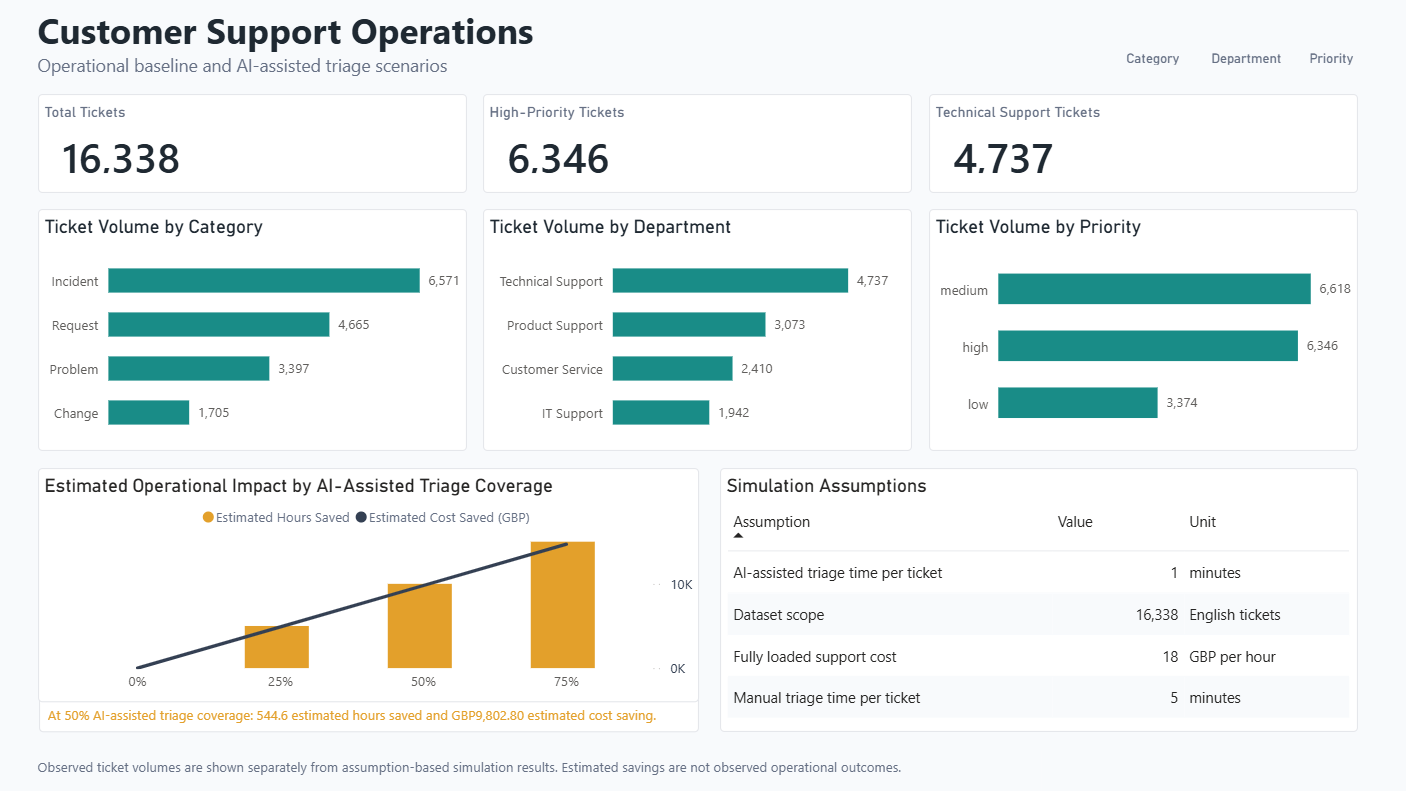
The dataset has 16,338 English tickets. A 50% coverage scenario estimates 544.6 hours and £9,802.80 saved.
The workload is observed. The savings are simulated from explicit time and cost assumptions.
Use the scenario to size interest, not to justify automation before validation.
Why this visual exists. Accuracy, confusion, coverage, and estimated error risk are shown beside the routing policy.
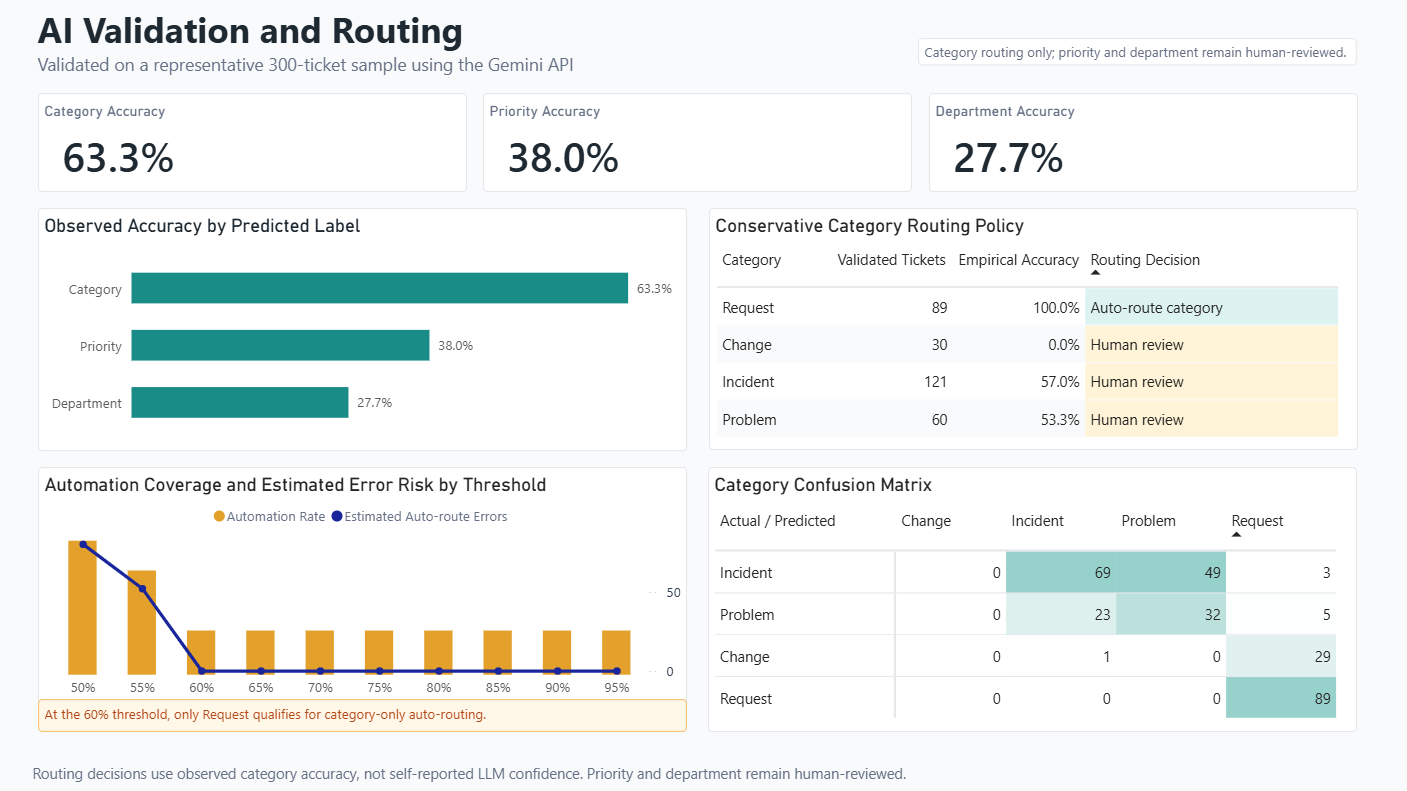
Category accuracy is 63.3%. Priority is 38.0%, and department is 27.7%. Only 89 Request cases reach 100% observed category accuracy.
Model confidence is not a control. Empirical performance limits automation to one narrow category case.
Allow limited Request category routing. Keep priority, department, and other categories under human review.
Why this visual exists. Recurring themes are linked to evidence-bounded self-service actions, while wording-quality issues remain visible.
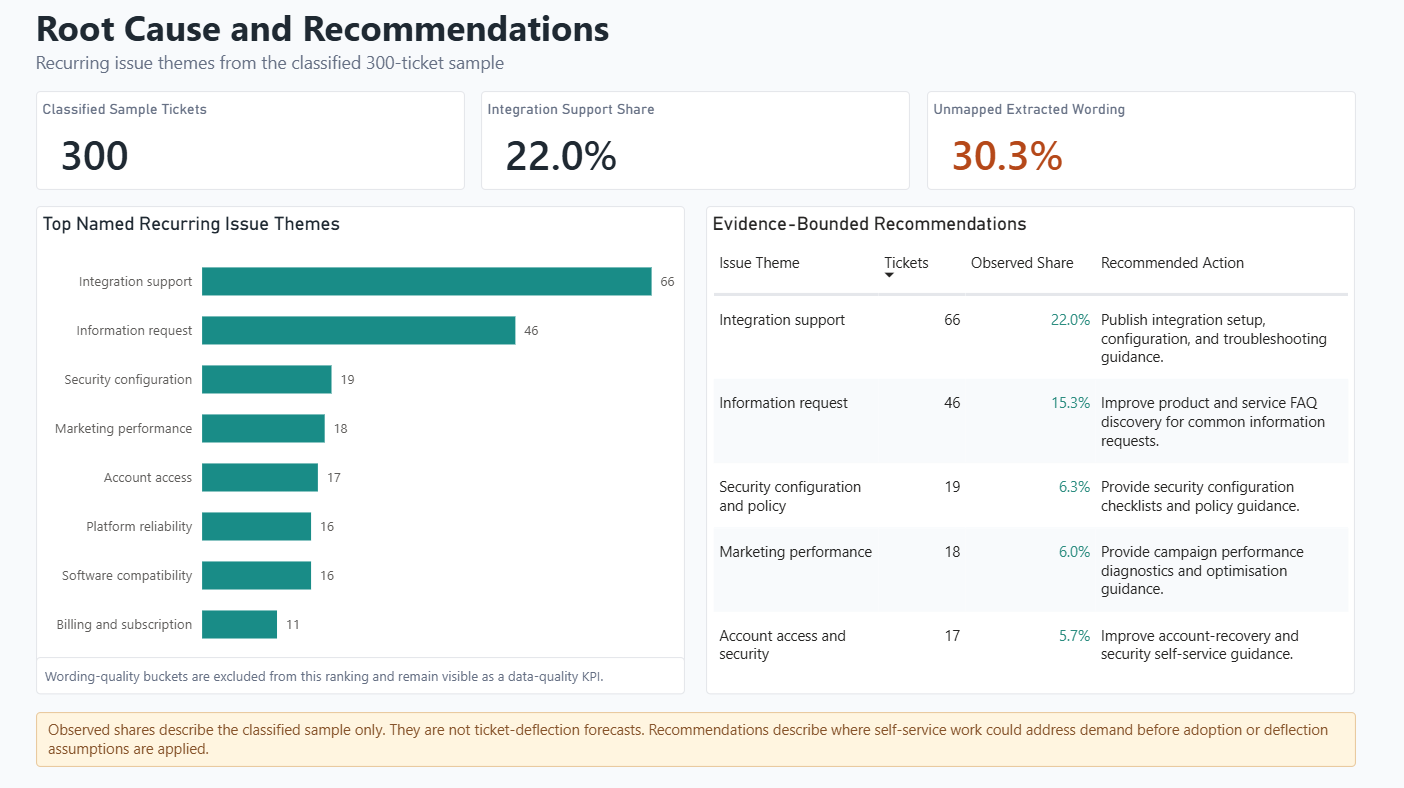
Integration support is the largest named theme at 66 tickets, or 22.0% of the classified sample. Unmapped wording is 30.3%.
The theme supports a content opportunity, not a forecast of ticket deflection.
Improve integration setup and troubleshooting guidance, then measure adoption and ticket outcomes.
Source: original Power BI screenshots from the project repository. Savings are scenarios; model results are from a 300-ticket evaluation sample.
Related concepts
Governance
Metrics
Trust
The policy uses empirical accuracy and sample size. Predictions that fail either condition remain under human review.
recommendations = accuracy.copy()
eligible = (
    (recommendations["empirical_accuracy"] >= decision_threshold)
    & (recommendations["ticket_count"] >= minimum_sample_tickets)
)
recommendations["routing_recommendation"] = eligible.map(
    {True: "Auto-route category", False: "Human review"}
)
Priority, department, and the other categories remain under human review.