Treat each month as a controlled intake
I applied deterministic file precedence and recorded source provenance for every reporting cycle.
Operational Reporting · Data Quality
A repeatable monthly reporting process for workforce, availability, demand, and delivery performance.
My approach
I applied deterministic file precedence and recorded source provenance for every reporting cycle.
I classified rows as Accepted, Review Required, or Rejected and reconciled totals across sources.
I used a KPI dictionary, star schema, Excel PivotTables, and Power BI views for repeatable use.
The problem
A new file can contain revised, duplicate, or invalid records. Managers still need consistent KPI outputs.
Select the correct file version and preserve source provenance.
Classify records as Accepted, Review Required, or Rejected.
Give non-technical managers a stable operational view.
How the system works
Each reporting period enters the same controlled path.
Decision evidence
Three views move from portfolio status to service pressure and then to reporting trust.
Why this visual exists. Workforce, demand, delivery, pressure, and provider alerts are visible in one management view.
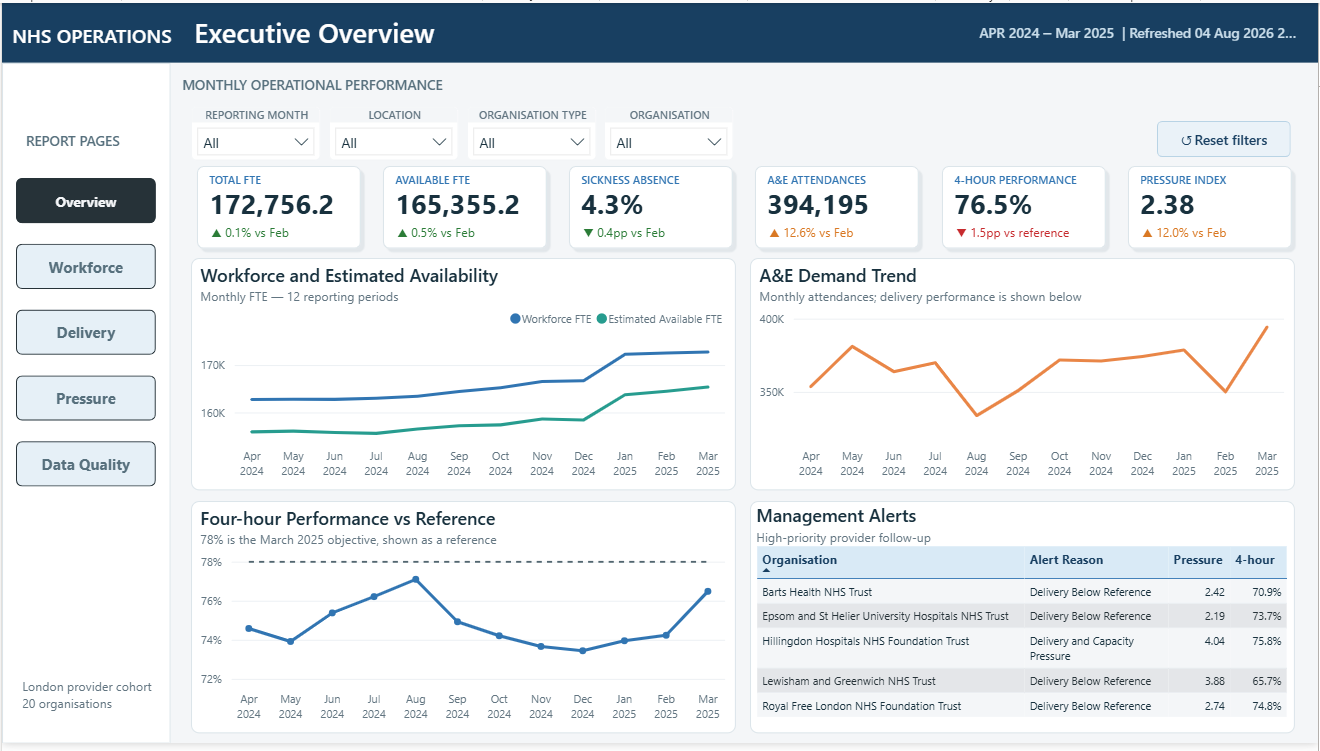
March demand rose 12.6% from February while four-hour performance was 76.5%, 1.5 percentage points below the reference.
The headline connects rising activity to delivery pressure, while the alert table identifies providers for review.
Move to provider-level demand and long-wait analysis before assigning operational action.
Why this visual exists. Demand, admissions, four-hour breaches, and 12-hour waits are shown together so volume and service failure are not confused.
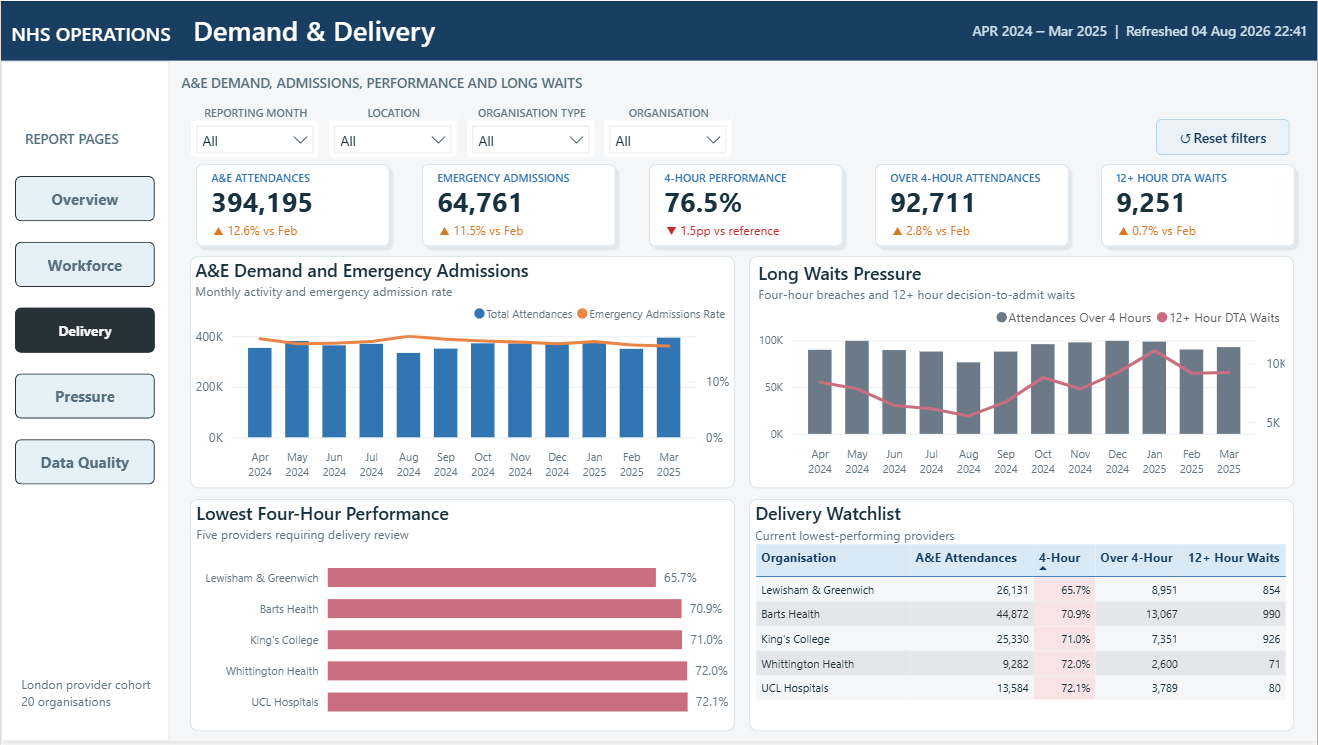
Lewisham and Greenwich has the lowest four-hour performance at 65.7%. Barts has the largest over-four-hour count in the watchlist at 13,067.
A low rate and a high breach count describe different operational problems.
Review rate, volume, and long waits together before prioritising provider support.
Why this visual exists. File status, record classification, reconciliation, and exceptions make the reporting boundary visible.
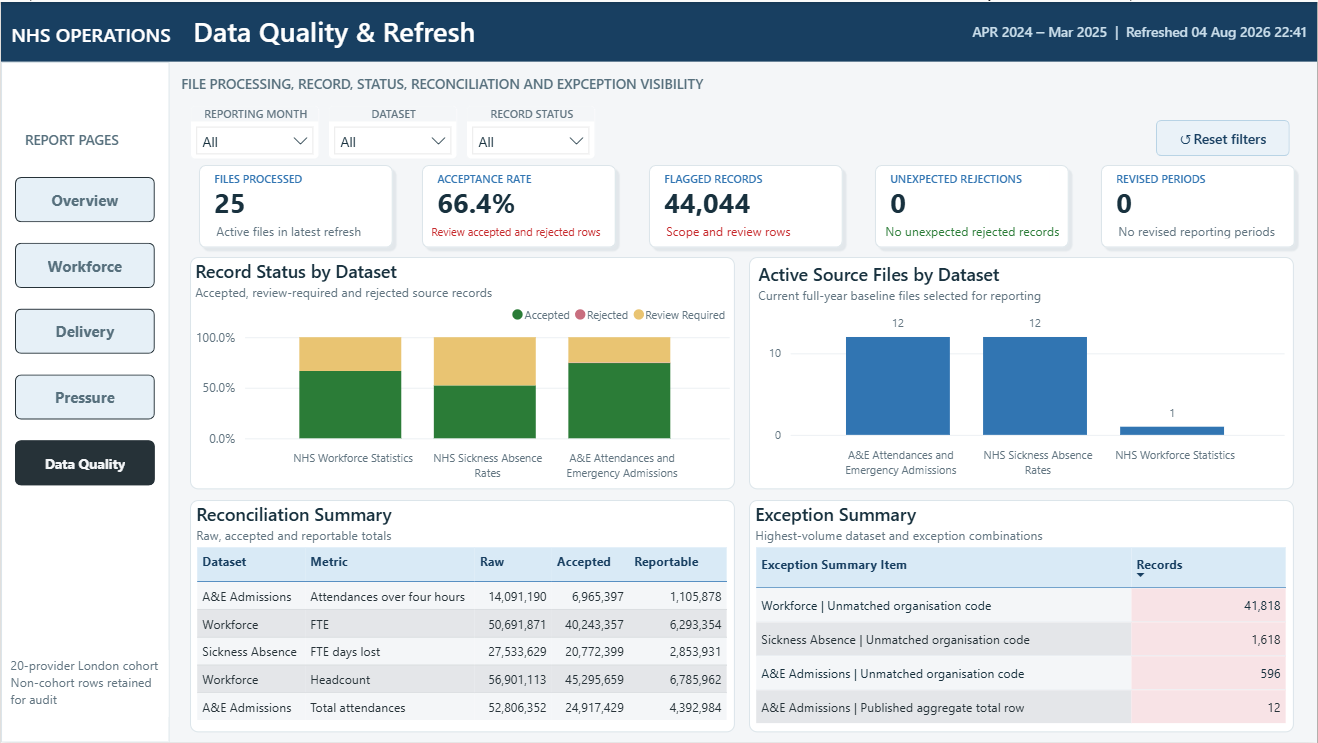
The refresh processed 25 files, flagged 44,044 records, and recorded zero unexpected rejections or revised periods.
A 66.4% acceptance rate is not hidden. Review-required records remain traceable by dataset and exception type.
Publish the governed view while routing unmatched organisation codes to review.
Source: original Power BI screenshots from the project repository. Public aggregate data; not a live NHS production deployment.
Related concepts
Trust
Modelling
Operations
Metrics
The transformation rejects broken records, routes uncertain schema changes to review, and accepts only records that pass the controls.
View implementation on GitHub ↗
if List.Count(MissingColumns) > 0 then
    "Rejected"
else if [ReportingMonth] = null or [MeasureValue] < 0 then
    "Rejected"
else if List.Count(UnexpectedColumns) > 0 then
    "Review Required"
else
    "Accepted"